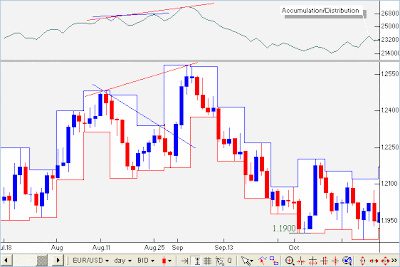
The use of trendline analysis is just to help forex traders establish levels of resistance and support for your market prices. With this analysis intact, you will be able to know when to get in and out of your trading positions.
Although, many traders do not focus on using trendline analysis, because they feel it is excessively subjective in nature. Well, that is not altogether false, but there are also many advantages that are offered to traders, such as focusing the attention on the price movement, and filtering out the market noise.
So if these reasons are there, trendline analysis is the first thing to consider when determining the existence of the trend. If you do not get anything from your trendline analysis, then there is not a trend afterall.
Trendline analysis is most suited when it starts with a long timeframes such as the daily or weekly charts, then it moves into a more shorter timeframe (hourly or 4-hourly). By using this, shorter support/resistance can be seen. You will surely be able to recognize the vital support/resistance levels first, and then the less vital onces next.
With this feature, you will be able to focus on good, long trends, rather than staying on short trends that show themselves.
Another technical indicator which can be used to identify if a trend is in place is the directional movement indicator (DMI). With the use of DMI, guesswork is removed, and the confirmation of the trend is validated in combination with trendline analysis.
The DMI system composes of the ADX (average directional movement index) and the DI+ and DI- lines.
The ADX can determine if there is a market trend, not minding if it is an uptrend or downtrend. If you get a measurement above 25, it indicates there is a trend in position, and a reading below 20 means that there is no trend in position. Also you can determine the strength of a trend. If the ADX is high, then the trend is strong, and if the ADX is low, the trend is not strong.
The DMI system gives the best result when the components are both used. You can use the DI+ and DI- lines as your trading signals. When the DI+ line crosses up through the DI- line, it means a buy signal, and when the DI- crosses up through the DI+ line, then it means a sell signal.


Post a Comment