skip to main | skip to sidebar
Forex help
RSS

What is a pip?

currency, EUR/JPY, EUR/USD, GBP/USD, trade, USD/JPY 0 comments

Forex price are quoted in pips. Pip represents "percentage in point", and this is the 4th decimal place, that is 1/100th of one percent. In EUR/USD, a 3 pip spread is usually quoted as 1.2400/1.2403. If you are familiar with the quote prices of many currencies, you will discover that only the Japanese Yen is quoted in 2 decimal places. All other currencies are quoted in 4 decimal places.

For instance, the USD/JPY 4 pip spread is quoted as 113.00/113.04. This is like 1/100th of the Yen, compared to the 1/1000th ot most other currencies.

Base currency
Image tags: orex, dorex, gorex, rorex.
Base currency

1. Base currency
When a base currency is the US Dollars, and the currency pair goes up, then it means that the US dollars has appreciated against the quoted currency.

Example, in the USD/JPY pair, if the first is 118.30, and after a while the price becomes 119.00, then it is said that the dollar have appreciated against the Japanese yen. It can also mean that the dollar is now strong enough to purchase more Japanese yen.

But there are certain exceptions to the general rule, such as the British Pound (GBP), Euro (EUR), and the Australian dollar (AUD). Example, when you see the GBP/USD quote price as 1.9000, this means that 1 British pound can buy 1.9000 US dollars. This also applies to the EUR/USD pair, and some others.

In this type of currency pair where the US Dollar is not the base currency, when there is a rise in the price of the quote, it means the dollar is getting weaker. This is because you need more money to be able to buy the base currency, such as the Euro, Pound, and Australian dollar.

And consequently, when the rise is also going down, it means the dollar is take a rise in value. And you need less US dollars to buy the base currency.

Cross currency
Image tags: dorex trade, gorex trade, rorex trade.
Cross currency

2. Cross currency
Such currencies pair that doesn't have the US dollar are usually referred to cross currencies, but the general rule are the same. Example, in the EUR/JPY of quote price of 125.90 means that the you need 125.90 Japanese yen to purchase 1 Euro. The basic rule is the same. If you get into the Forex trading, you will see that there is always a "bid" and "ask" price.

The bid quote is the price where you can go short the base currency in a particular trade, and the ask price is the price where you can go long on the base currency on a trade.

All these will get familiar to you when you stay on Forex for a while.


Sunday, November 23, 2008


Using technical indicators 3

economic indicators, forex analysis 0 comments

In this part three of using technical indicators, we will be talking about bollinger bands, MACD, and fibonacci replacements. So sit back and relax while you learn.

Bollinger bands
Image tags: torex, corex, vorex, frex.
Bollinger bands

1. Bollinger bands
The use of bollinger bands are to determine extreme highs or lows with relationship to price. They come about with volatility curves. The use of bollinger bands are more complex han many others. It involves the establishment of parameters for trading, depending on the moving average of a specific instrument.
You might need the help of an experienced fores trader to help you dive through this technical indicator, because it can not be explained without many different diagrams.

MACD - Moving Average Convergence Divergence
Image tags: my rorex trade, torex trade, corex.
MACD - Moving Average Convergence Divergence

2. MACD (Moving Average Convergence Divergence)
This indicator is more detailed moving average used to search out trading signals with the use of price charts. The MACD developed by Gerald Appel plots the difference between a 26-day exponential moving average and a 12-day exponential moving average. At most time, a 9-day moving average is used as a line for trigger. This means that when the MACD line crosses lower than the trigger, it means there is a bearish signal. And vice versa, for the bullish signal.

What many forex traders do is to allow MACD provide them with an early divergent signal so that they can have an idea of when to get into the market.

In the case where the MACD is positive, and there are higher lows, it could mean a signal for buying a position. And if your MACD shows lower highs, this can also mean a signal for selling a position.

Fibonacci retracements
Image tags: free fprex, f9rex, f0rex, fkrex.
Fibonacci retracements

3. Fibonacci retracements
This type of indicators are a series of numbers that was discovered by Leonardo da Pisa who is a mathematician during the 12th century.

The fibonacci retracement is very useful in analysing pullbacks in forex trading today. It involves the anticipation of trand changes not far from the created lines. After a real and good price move in either direction, there is usually a price retracement along the original move in either direction. As these retracements go on, there are usually occurrence of supports and resistance levels at or close near the Fibonacci retracement levels.


Monday, November 10, 2008


Using technical indicators 2

economic indicators, forex analysis 0 comments

Another indicatoe we will talk about is the Stochastics and the Relative Strength Index. These tow indicators are also very helpful in market forecast.

Stochastics
Image tags: best fkrex, flrex, foex, foeex.
Stochastics

1. Stochastics
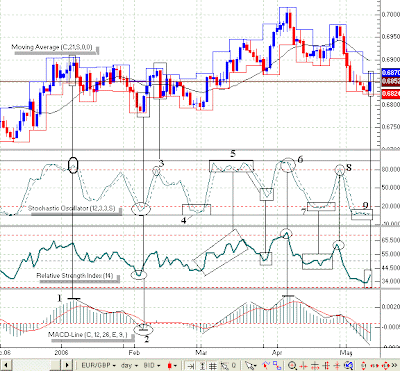
This indicator helps fores traders to determine and monitor a trend's sustainability. Forex trader can determine the closing price of a current trade with relationship to the performance of the previous indicator that was analysed. In the use of stochastics, two measured and represented lines %K and %D are drawn on a scale from range 0 to 100.

If you get an indication above 80, it means that there will be a very strong upward movement of price, and if your indications show less than 20, it means there is also a strong movement downwards.

Stochastics EUR-GBP
Image tags: try frex trade, firex trade, fprex.
Stochastics EUR-GBP

You simply do not need the mathematical calculations, all you need is what you are told by the stochastics.

The fast line and fast indicator is the %K, while the slow line is the %D. When there is about to be a reverse direction in the market prices, the %K line crosses over the %D line.

Stochastics GBP-JPY
Image tags: ultimate foeex, fotex, fo4ex.
Stochastics GBP-JPY

Take note that sometimes there could be several crossing of both lines in a choppy market, when prices are flunctuating, so you don't have to bother about it. It actually means no market directions at this point.

The use of stochastics is very helpful in the determination of trend strength, and the possibility of a reversal in market prices.

Relative Strength Index
Image tags: money trade, fodex trade, fofex.
Relative Strength Index

2. Relative Strength Index
The use of the RSI is mainly to measure the momentum of a market direction. Just like the stochastics, it is plotted on a range scale of 0 - 100. If you get a measurement of more than 80, then you buy into the market, and a measurement of less than 20, you need to sell out of the market.

With this you simply understand that prices do not go in one direction forever, when the go up, at a point it must surely come down, and RSI will help you determine that time. You can also act on divergence as a forex trader using RSI, but you have to be patient enough to wait for conformations before diving to open a position.

These two indicators explained in part 2 are for your to master and get tem to work in your favor.


Monday, November 10, 2008


Using technical indicators 1

economic indicators, profits 0 comments

Once you tap into the use of technical indicators, and you master them, then you are on the beginning to making good profits from forex trading. In the use of technical analysis, the main tool is the price chart. But you also have to know that this is not the only importnt thing. You can just look at a price chart, and expect to drive your way into making profit.

technical indicators
Image tags: top fodex, fofex, forx, forwx.
technical indicators

Technicians have emplyed the use of candlesticks, bar charts, Xs and Os, and all these have helped them get into the basic of understanding the price direction, and knowing everything about it. In this section we will be talking moving averages. The moving averages indicator exist in 3 types.

We have the simple, weighted, and exponential. All these functions in different ways. Lets see them.

SMA Simple moving average
Image tags: foex trade, foeex trade, fotex.
SMA - Simple moving average

1. Simple moving average
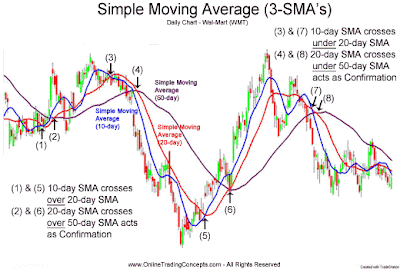
With this indicator, you can give an equal weight to each price point over a period of time. Here the user will determine if the high,low, or close is used, then he adds the price points together and averages it. Then this individual price points are added to the previous string and a line is drawn. As new price points are added, the sample set will continue to drop off the oldest points.

This is actually the most commonly used moving average among all of them.

Weighted moving average
Image tags: get your courses fore, forez, forec, fores.
Weighted moving average

2. Weighted moving average
With this type, there is more emphasis on the latest data. There is always a weighting factor which varies from day to day. You will then multiply each data point by the weighting factor. When you use this, you will be able to smooth out a curve, and have the average to be very responsive to current price changes.

Exponential moving average
Image tags: express forrx trade, forsx trade, fordx.
Exponential moving average

3. Exponential moving average
This also works like the weighted moving average. The exponential moving average multiplies a percentage of the most recent price by the former average price of that period. This is a more complex method, but once you master the logic, then you are on the go.

You can be sure that all 3 types of moving work different and you need ample time to study, draw, and plot as many lines as possible to be able to determine the market trend.

In short, being a technician is not a day's work, it is about devotion, and setling for the best and right indicator that works for you.


Monday, November 10, 2008


Newer Posts Older Posts Home
Subscribe to: Posts (Atom)

    Label Cloud

    Blog Archive

    • ▼  2008 (25)
      • ▼  November (4)
        • What is a pip?
        • Using technical indicators 3
        • Using technical indicators 2
        • Using technical indicators 1
      • ►  September (1)
      • ►  July (11)
      • ►  June (4)
      • ►  May (1)
      • ►  April (1)
      • ►  March (1)
      • ►  February (1)
      • ►  January (1)
Forex help | © 2008-2010 All rights reserved.