For you to be successful as a forex trader, you definitely need to understand the use of indicators for determining the direction of the market.
Getting to understand this aspect of forex trading gives a real edge over ordinary speculators. Although it also takes time to be able to understand them, but once you do, then you are on the beginning of your wealth creation using forex trading.
For the purpose of introduction, you will be given a few technical indications that usually help forex users get a view of where the market is going over a period of time. This time period may be one day for intra-day traders, or a long term for long term traders. Also, mastering these technical indicators is also very important.
Some of these indicators that are helpful are grouped into different category for your easy knowledge and understanding.
1. Strength indicators
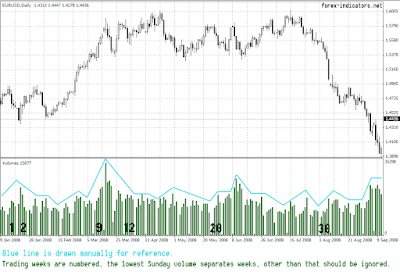
These type of indicators gives you an idea of the strength of the market and its direction with regards to price and time, with the amount of participation of in a trade.
An example of this indicator is the "volume indicator". With this indicator you can be sure you are forcasting the right market direction.
2. Trend indicators
The word trend in forex means the consistent movement of price in a particular direction with regards to time. There are 3 types of trends, which are the up trend, down trend, and sideways. With this kind type of address, you can simply figure out when to enter and get out of a position.
Some examples are the moving averages, trend lines, and others.
3. Cycle indicators
This type of indicators gives a repetition of patterns on market direction. Such events as eletions, particular seasons, and many other activities fall under this cycle indicator.
Examples are the Elliott wave indicator.
4. Volatility indicators
An example is the Bollinger bands. This kind of indicator describes sizes, and variations in market prices.
Of course prices flunctuates, and getting the right indicator is the key.
5. Support/resistance indicators
With this type of indicator you can determine the limits of the market prices. This means that you can set a resistance for price rise, and a support for price falls.
6. Momentum indicators
Examples are Stochastic, MACD, RSI. With this, you can figure out the speed of market prices with relationship to time.


Post a Comment